Is a battery worth it? The answer was hiding in the solar data
The situation
A business run from home, with rooftop solar, was already buying electricity on a wholesale‑linked plan, where the price changes through the day. The owner wanted to know whether a battery would pay for itself.
Standard comparison tools assume a conventional plan, so they could not answer the question for this site. The answer had to come from the site's own data.
What we looked at
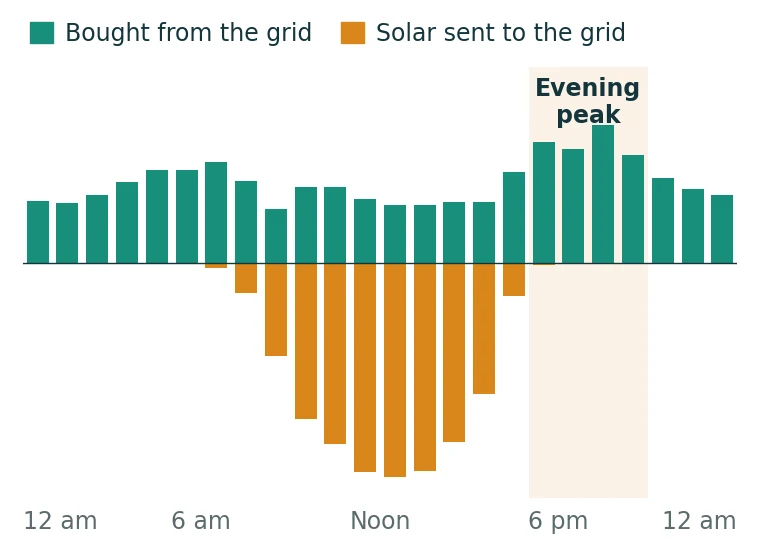
Two years of 5‑minute interval data from the meter: every unit bought from the grid and every unit of solar sent to it. We mapped when energy is bought across the day and the seasons, how much falls in the evening peak, and how much spare solar is available to charge a battery.
We then ran a battery through the data interval by interval, to see what it would have done on each of those 730 days, not on an average day.
What we found
About two thirds of the grid energy was bought outside solar hours, in the evening and overnight. That is where a battery does its work, and the evening peak alone was about a quarter of all grid purchases.
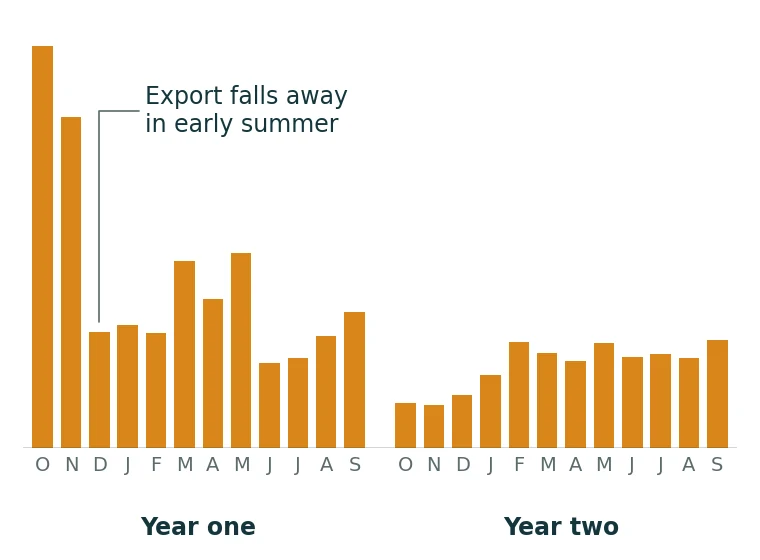
The surprise was in the solar. Energy sent to the grid had halved from one year to the next. The day‑by‑day pattern showed the panels were not failing: on many sunny days the system was being held back to match the house, with almost nothing sent to the grid.
The owner confirmed the reason: on a wholesale‑linked plan the feed‑in price can turn negative, and the solar is curtailed at those times so the site doesn't pay to export.
That changed the battery case. Charged only from the solar the meter recorded, the modelled battery covered about 40% of grid purchases. If it also stored the solar that was being held back, it covered up to about 85%.
On the purchase price alone, the payback was marginal. The rebate, and the solar being held back, were what moved it.
What changed
The owner received a short checklist to complete before asking for quotes: confirm the curtailment settings, check rebate eligibility, and ask suppliers to quote against the modelled figures.
The owner came away with a clear idea of a realistic payback, and used it to negotiate the battery installation.